
| [ < ] | [ > ] | [ << ] | [ Up ] | [ >> ] | [Top] | [Contents] | [Index] | [ ? ] |
7.35 contour
This package draws contour lines.
To construct contours corresponding to the values in an array c
for a function f on box(a,b), use
guide[][] contour(real f(real, real), pair a, pair b,
                  real[] c, int nx=ngraph, int ny=nx,
                  interpolate join=operator --);
The integers nx and ny define the resolution.
The default resolution, ngraph x ngraph (here ngraph
defaults to 100), can be increased for greater accuracy. The
default interpolation operator is operator -- (linear). Spline
interpolation (operator ..) may produce smoother
contours but it can also lead to overshooting.
To construct contours for an array of data values on a uniform
two-dimensional lattice on box(a,b), use
guide[][] contour(real[][] f, real[][] midpoint=new real[][],
                  pair a, pair b, real[] c,
                  interpolate join=operator --);
To construct contours for an array of data values on a nonoverlapping
mesh specified by the two-dimensional array z, optionally
specifying an estimate for the values of f at the mesh midpoints, use
guide[][] contour(pair[][] z, real[][] f,
                  real[][] midpoint=new real[][], real[] c,
                  interpolate join=operator --);
To construct contours for an array of values f specified at
irregularly positioned points z, use the routine
guide[][] contour(pair[] z, real[] f, real[] c,
                  interpolate join=operator --);
The contours themselves can be drawn with one of the routines
void draw(picture pic=currentpicture, Label[] L=new Label[],
          guide[][] g, pen p=currentpen)

void draw(picture pic=currentpicture, Label[] L=new Label[],
          guide[][] g, pen[] p)
The following simple example draws the contour at value 1
for the function z=x^2+y^2, which is a unit circle:
import contour;
size(75);

real f(real a, real b) {return a^2+b^2;}
draw(contour(f,(-1,-1),(1,1),new real[] {1}));

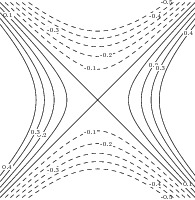
The next example draws and labels multiple contours for the function
z=x^2-y^2 with the resolution 100 x 100, using a dashed
pen for negative contours and a solid pen for positive (and zero) contours:
import contour;

size(200);

real f(real x, real y) {return x^2-y^2;}
int n=10;
real[] c=new real[n];
for(int i=0; i < n; ++i) c[i]=(i-n/2)/n;

pen[] p=sequence(new pen(int i) {
    return (c[i] >= 0 ? solid : dashed)+fontsize(6);
  },c.length);

Label[] Labels=sequence(new Label(int i) {
    return Label(c[i] != 0 ? (string) c[i] : "",Relative(unitrand()),(0,0),
                 UnFill(1bp));
  },c.length);

draw(Labels,contour(f,(-1,-1),(1,1),c),p);
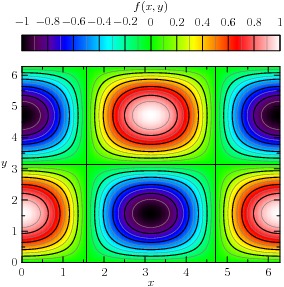
The next example illustrates how contour lines can be drawn on color density images:
import graph;
import palette;
import contour;

size(10cm,10cm,IgnoreAspect);

pair a=(0,0);
pair b=(2pi,2pi);

real f(real x, real y) {return cos(x)*sin(y);}

int N=200;
int Divs=10;
int divs=2;

defaultpen(1bp);
pen Tickpen=black;
pen tickpen=gray+0.5*linewidth(currentpen);
pen[] Palette=BWRainbow();

scale(false);

bounds range=image(f,Automatic,a,b,N,Palette);

// Major contours

real[] Cvals=uniform(range.min,range.max,Divs);
draw(contour(f,a,b,Cvals,N,operator --),Tickpen);

// Minor contours
real[] cvals;
for(int i=0; i < Cvals.length-1; ++i)
  cvals.append(uniform(Cvals[i],Cvals[i+1],divs)[1:divs]);
draw(contour(f,a,b,cvals,N,operator --),tickpen);

xaxis("$x$",BottomTop,LeftTicks,above=true);
yaxis("$y$",LeftRight,RightTicks,above=true);

palette("$f(x,y)$",range,point(NW)+(0,0.5),point(NE)+(0,1),Top,Palette,
        PaletteTicks(N=Divs,n=divs,Tickpen,tickpen));
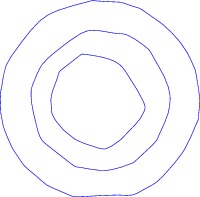
Finally, here is an example that illustrates the construction of contours from irregularly spaced data:
import contour;

size(200);

int n=100;

pair[] points=new pair[n];
real[] values=new real[n];

real f(real a, real b) {return a^2+b^2;}

real r() {return 1.1*(rand()/randMax*2-1);}

for(int i=0; i < n; ++i) {
  points[i]=(r(),r());
  values[i]=f(points[i].x,points[i].y);
}

draw(contour(points,values,new real[]{0.25,0.5,1},operator ..),blue);
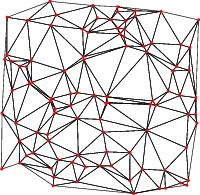
In the above example, the contours of irregularly spaced data are constructed by
first creating a triangular mesh from an array z of pairs:
int[][] triangulate(pair[] z);
size(200);
int np=100;
pair[] points;

real r() {return 1.2*(rand()/randMax*2-1);}

for(int i=0; i < np; ++i)
  points.push((r(),r()));

int[][] trn=triangulate(points);

for(int i=0; i < trn.length; ++i) {
  draw(points[trn[i][0]]--points[trn[i][1]]);
  draw(points[trn[i][1]]--points[trn[i][2]]);
  draw(points[trn[i][2]]--points[trn[i][0]]);
}

for(int i=0; i < np; ++i)
  dot(points[i],red);
The example Gouraudcontour illustrates how to produce color
density images over such irregular triangular meshes.
Asymptote uses a robust version of Paul Bourke's Delaunay triangulation
algorithm based on the public-domain exact arithmetic predicates written by
Jonathan Shewchuk.
| [ < ] | [ > ] | [ << ] | [ Up ] | [ >> ] | [Top] | [Contents] | [Index] | [ ? ] |