
| [ << ] | [ < ] | [ Up ] | [ > ] | [ >> ] | [Top] | [Contents] | [Index] | [ ? ] |
8.35 flowchart
This package provides routines for drawing flowcharts. The primary
structure is a block, which represents a single block on the
flowchart. The following eight functions return a position on the appropriate
edge of the block, given picture transform t:
pair block.top(transform t=identity());
pair block.left(transform t=identity());
pair block.right(transform t=identity());
pair block.bottom(transform t=identity());
pair block.topleft(transform t=identity());
pair block.topright(transform t=identity());
pair block.bottomleft(transform t=identity());
pair block.bottomright(transform t=identity());
To obtain an arbitrary position along the boundary of the block in user coordinates, use:
pair block.position(real x, transform t=identity());
The center of the block in user coordinates is stored in
block.center and the block size in PostScript coordinates
is given by block.size.
A frame containing the block is returned by
frame block.draw(pen p=currentpen);
The following block generation routines accept a Label, string, or frame for their object argument:
- rectangular block with an optional header (and padding
dxaround header and body): -
block rectangle(object header, object body, pair center=(0,0), pen headerpen=mediumgray, pen bodypen=invisible, pen drawpen=currentpen, real dx=3, real minheaderwidth=minblockwidth, real minheaderheight=minblockwidth, real minbodywidth=minblockheight, real minbodyheight=minblockheight); block rectangle(object body, pair center=(0,0), pen fillpen=invisible, pen drawpen=currentpen, real dx=3, real minwidth=minblockwidth, real minheight=minblockheight); - parallelogram block:
-
block parallelogram(object body, pair center=(0,0), pen fillpen=invisible, pen drawpen=currentpen, real dx=3, real slope=2, real minwidth=minblockwidth, real minheight=minblockheight); - diamond-shaped block:
-
block diamond(object body, pair center=(0,0), pen fillpen=invisible, pen drawpen=currentpen, real ds=5, real dw=1, real height=20, real minwidth=minblockwidth, real minheight=minblockheight); - circular block:
-
block circle(object body, pair center=(0,0), pen fillpen=invisible, pen drawpen=currentpen, real dr=3, real mindiameter=mincirclediameter); - rectangular block with rounded corners:
-
block roundrectangle(object body, pair center=(0,0), pen fillpen=invisible, pen drawpen=currentpen, real ds=5, real dw=0, real minwidth=minblockwidth, real minheight=minblockheight); - rectangular block with beveled edges:
-
block bevel(object body, pair center=(0,0), pen fillpen=invisible,
            pen drawpen=currentpen, real dh=5, real dw=5,
            real minwidth=minblockwidth, real minheight=minblockheight);
To draw paths joining the pairs in point with right-angled lines,
use the routine:
path path(pair point[] ... flowdir dir[]);
The entries in dir identify whether successive
segments between the pairs specified by point should be drawn
in the Horizontal or Vertical direction.
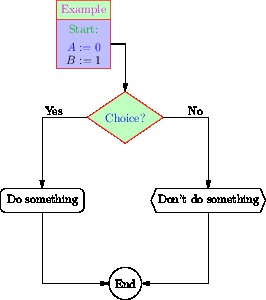
Here is a simple flowchart example (see also the example
controlsystem.asy):
size(0,300);

import flowchart;

block block1=rectangle(Label("Example",magenta),
		       pack(Label("Start:",heavygreen),"",Label("$A:=0$",blue),
			    "$B:=1$"),(-0.5,3),palegreen,paleblue,red);
block block2=diamond(Label("Choice?",blue),(0,2),palegreen,red);
block block3=roundrectangle("Do something",(-1,1));
block block4=bevel("Don't do something",(1,1));
block block5=circle("End",(0,0));

draw(block1);
draw(block2);
draw(block3);
draw(block4);
draw(block5);

add(new void(picture pic, transform t) {
    blockconnector operator --=blockconnector(pic,t);
    //    draw(pic,block1.right(t)--block2.top(t));
    block1--Right--Down--Arrow--block2;
    block2--Label("Yes",0.5,NW)--Left--Down--Arrow--block3;
    block2--Right--Label("No",0.5,NE)--Down--Arrow--block4;
    block4--Down--Left--Arrow--block5;
    block3--Down--Right--Arrow--block5;
  });
| [ << ] | [ < ] | [ Up ] | [ > ] | [ >> ] | [Top] | [Contents] | [Index] | [ ? ] |
This document was generated on May 24, 2014 using texi2html 5.0.